
In these confusing times there’s a certain sense of power that comes with understanding, or at least trying to understand, the dynamics of disease spread and epidemiology. I certainly felt that as I’ve looked into the mathematics disease modeling over the course of this quarantine––a field that is absolutely fascinating, empowering, and daunting all at once. I recommend checking out Julian Lee’s article on his original disease modeling application, which describes the effects of visiting friends in a quarantine (his application is a randomized agent-based model as opposed to the more top-down mathematical models you’ll see here).
In this article, I present three epidemiology thinking problems, in ascending orders of difficulty, meant to put you in the position of the disease modeler. Have fun!
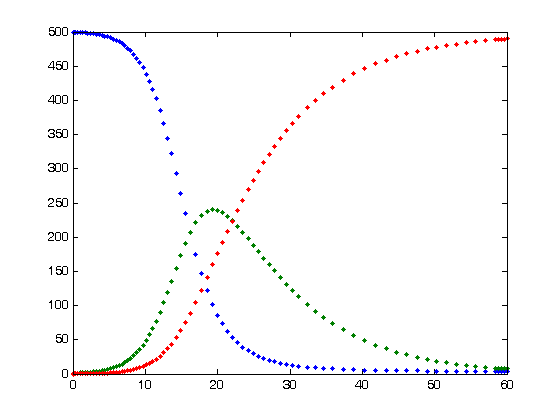
Fig: A graphical representation of an SIR (Susceptible-Infected-Recovered) Disease Model. The green curve is the curve that our social distancing efforts are “flattening.” This is the classic, top-down disease modeling approach
1) In epidemiology, R0 (“the basic reproductive number” or “r-naught”) is defined as the maximum number of new cases expected per infected person. The R0 of COVID-19 has been estimated to be 2.28 (Zhang, et al). An infected individual is expected to cause ß new cases per day. This is essentially the “birth rate.” Meanwhile, δ is the expected proportion of cases dying on a given day. This is essentially the “death rate.” Describe R0 in terms of ß and δ.
2) Does R0 tend to decrease, increase, or remain the same as a virus grows in an isolated population? Why or why not?
3) Consider the following differential equation to describe the spread of COVID-19, where ß and δ have the same values defined in problem 1.
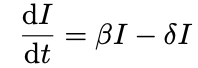
This is essentially a fancy mathematical way of saying that the rate at which the infection spreads is dependent on the number of people infected as well as the difference between the virus’ birth and death rates. In what ways does this model oversimplify real-life disease spread?
(Problems inspired by Rob J. de Boer’s Modeling Population Dynamics: a Graphical Approach, available here: http://theory.bio.uu.nl/rdb/books/mpd.pdf)
Click for Solutions!
1) R0 = ß/δ (1/δ is the mean number of days someone with the virus is expected to live.)
2) R0 decreases; as an infection grows, there will be more infected individuals around a given infected person, meaning that there are fewer people to infect.
3) There are a lot of answers to this question, which highlights the limitations of this top-down mathematical modeling. Here are a few.
- The ß value should not apply only to the infected population, but also to the healthy susceptible population.
- This model does not take into account the recovery rate.
- The virus’ birth rate will change, not only depending on the number of people with COVID but also depending on how well the population responds (social distancing, hand-washing, etc)
- The death rate will change based on what treatments are available.