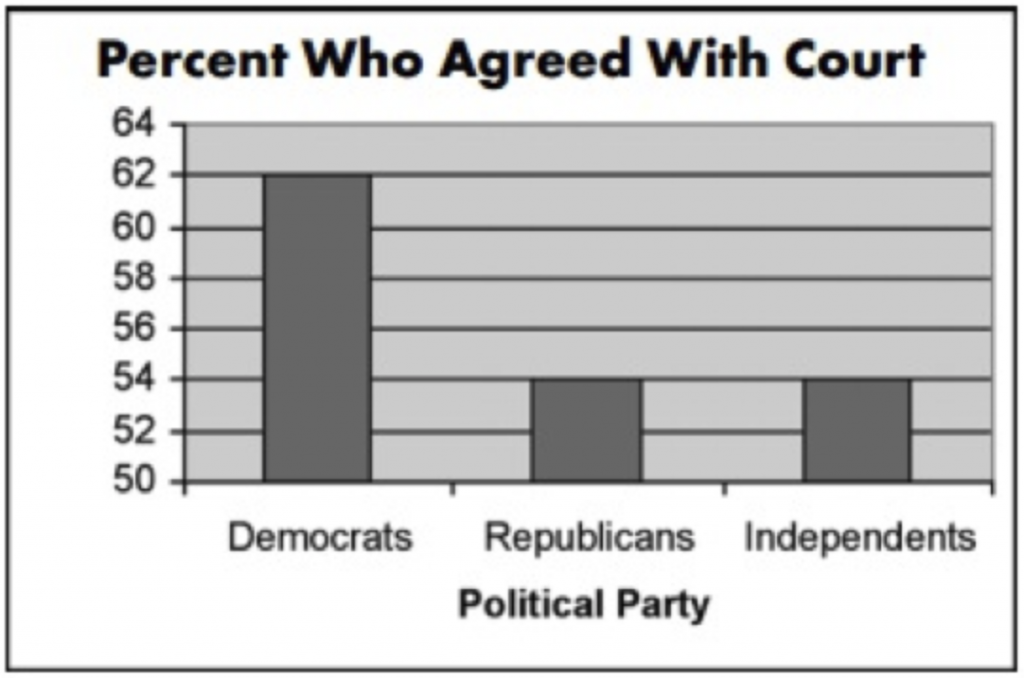
This graph is misleading because a) it doesn’t have a label for the y axis, and b) the graph makes the difference between Democrats and Republicans/Independents seem much larger when in reality, it’s only a 14% difference. Having different number marks would make this graph better.

Recent Comments