Refugee Stories
  • Home
  • DataViz
    • DataViz (2022)
    • DataViz (2023)
    • DataViz (2024)
  • FoodReview
    • Food Reviews (2022)
    • Food Reviews (2023)
    • Food Reviews (2024)
  • Gallery
    • Gallery (2022)
    • Gallery (2023)
    • Gallery (2024)
  • Stories
    • Stories (2022)
    • Stories (2023)
    • Stories (2024)
Select Page
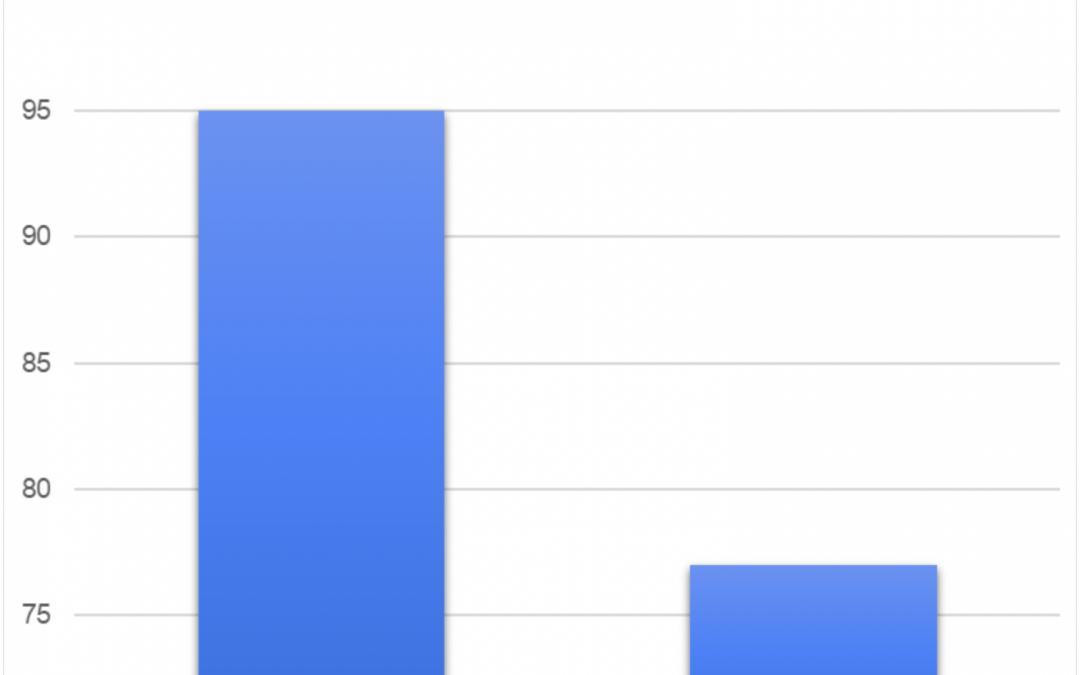
Misleading Graph on Sales

Misleading Graph on Sales

by Milenka Men | Jun 3, 2022 | DataViz (2022)

This graph shows the number of sales for two products. This graph is misleading since the y-axis does not start at zero. Oftentimes, the human brain is calibrated to start at zero, but the y-axis on this graph doesn’t start at zero making this visualization...
Next Entries »

Recent Posts

  • Russian Immigration- Natasha S. (family friend)
  • Kebab
  • Syrian Refugee arrivals in the United States Data Viz
  • The Forward Building NYC
  • Day 9

Recent Comments

  • dkarnaugh2024 on Jewish Immigrants from the Former Soviet Union to Israel
  • aglasofer2025 on Trip to Paterson
  • dkarnaugh2024 on Nyonya: Chinatown, NY
  • dkarnaugh2024 on Refugee Poem Summary/Analysis: Mimesis by Fady Joudah (2013)
  • dkarnaugh2024 on Russian Candies from Brighton Beach

Archives

  • June 2024
  • May 2024
  • June 2023
  • May 2023
  • June 2022
  • May 2022

Categories

  • DataViz
  • DataViz (2022)
  • DataViz (2023)
  • DataViz (2024)
  • Featured
  • Food Reviews (2022)
  • Food Reviews (2023)
  • Food Reviews (2024)
  • FoodReview
  • Gallery (2022)
  • Gallery (2023)
  • Gallery (2024)
  • Highlighted
  • Stories
  • Stories (2022)
  • Stories (2023)
  • Stories (2024)
  • Uncategorized

Meta

  • Log in
  • Entries feed
  • Comments feed
  • WordPress.org
A Pingry Spring Intensive Course by Dr. Dickerson, Dr. Lasevich, and Ms. Thuzar