
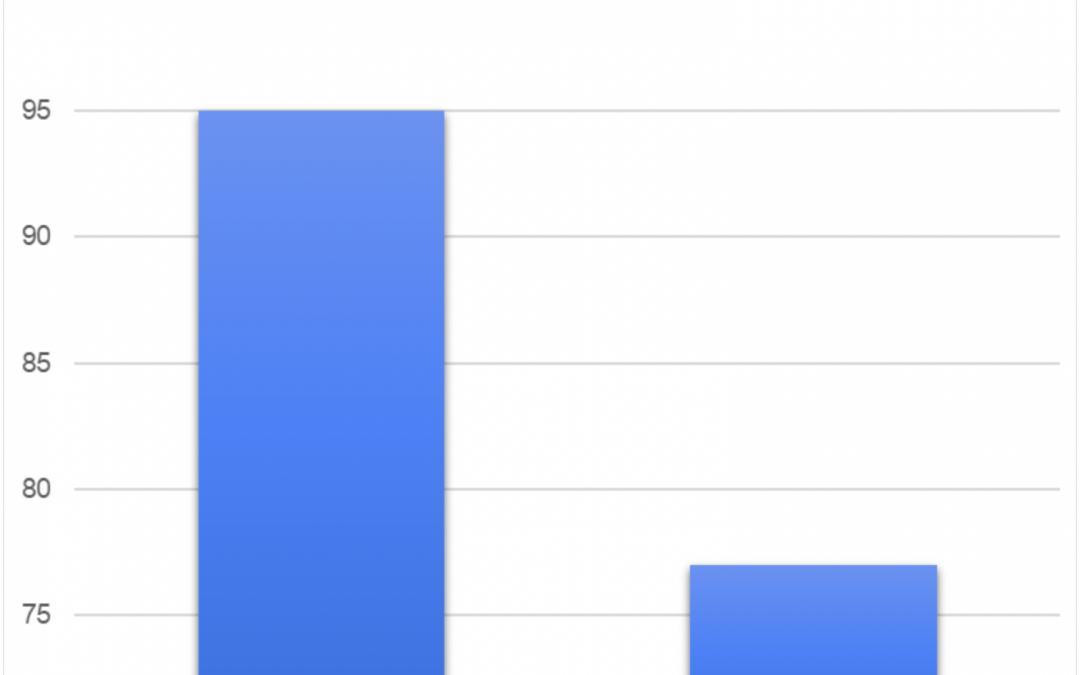

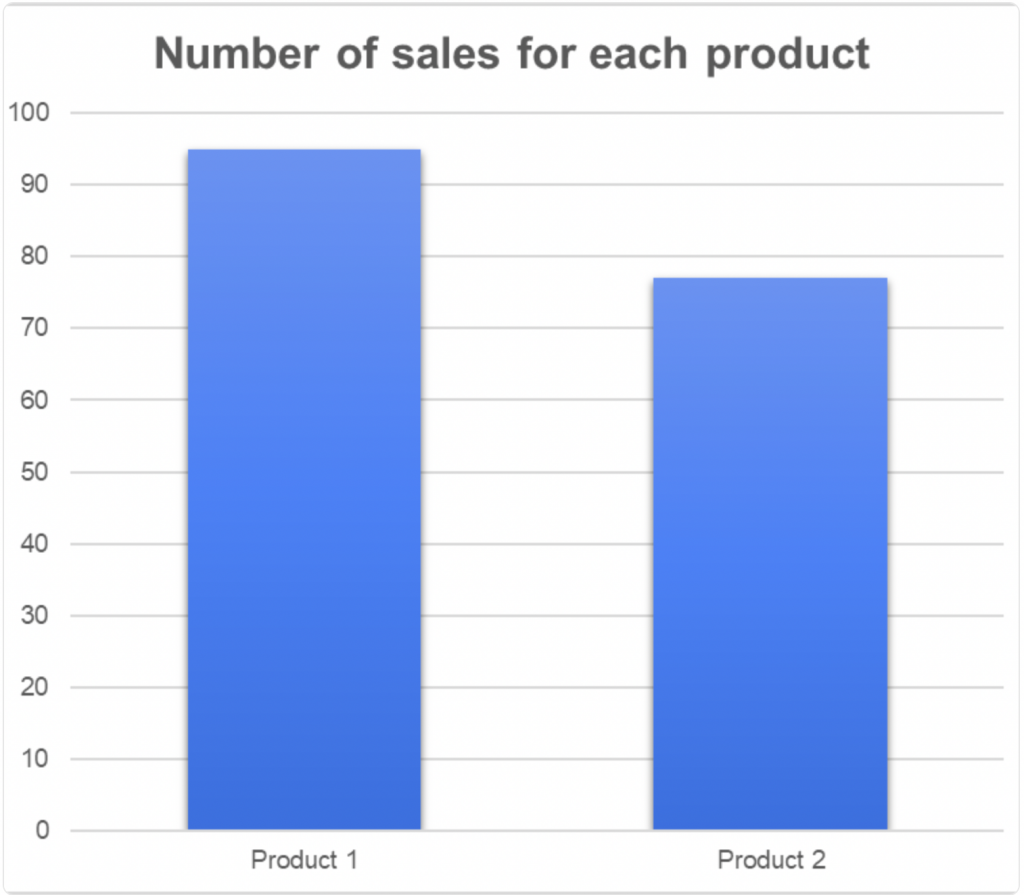
This graph is misleading since the y-axis does not start at zero. Oftentimes, the human brain is calibrated to start at zero, but the y-axis on this graph doesn’t start at zero making this visualization confusing to comprehend. The scale makes it look like Product 2 is completely failing, but in reality, the difference between the two isn’t as drastic.
very nice